|
550 729 01 |
|||
|
|
|||
|
Displaying Data in a Table
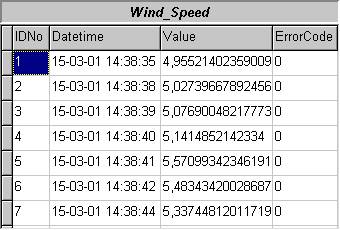
The Database Grid component provides a means to view and search the whole PC databuffer for a particular record for a logged variable. The system designer only needs to configure the PhyID of the variable (Variable Link), which if found to be the same as that of a Data Acquisition component included and configured within the design (as with a curve component), will display its database contents in the form of a scrollable table. When a table is shown on the PC screen, it will initially show the latest held value and time/date of the sample together with an IDNo and a status indication, on the last line. The arrow keys (or mouse wheel) can be used to scroll through individual entries, or <Ctrl>+ <Home> or <Ctrl> + <End> will show the first and last entries respectively. With the latter, the last line will be automatically updated when a legitimate sample value has been generated. Selecting a cell in a particular column and pressing the right mouse button, will provide the option to print the whole table or to locate a particular entry in that column. Selecting a specific block of entries will restrict the search or printout to that selection.
Data Logging MethodologyWhen using a Data Acquisition (local) component, the sample time is determined by the Update Time setting (P-NET request), where no further conditional processing is applied, and the value seen at that time (and seen as the last entry in the Database Grid table) is recorded as a confirmed log entry. However, when Remote Data Acquisition Components are used, the PC database is reflecting the data held in the DPI DataCollect Channel, which is synchronised every Update Time setting (P-NET request). Since conditional processing can be applied within the Data Collect Channels, the last value acquired and saved (and seen as the last entry in the Database Grid table) is not necessarily a final historical logged entry, and depends on the type and result of conditional processing. For example, if a value has been acquired (at sample time) which has not met a particular condition for data logging, e.g. a change in temperature has not deviated sufficiently (as defined by Deviation Tolerance), enabling a plot to be continued as a straight line approximation, then the ACTUAL value will be shown on the last line of the Database Grid and a new point or line plotted on the Curve. However, the IDNo for that sample will NOT change and no new log will be saved. This means that if the change between the last logged value, the last value sampled and the current value sampled could be joined together with a straight line within the deviation tolerance, then so could the last logged value and the current value, and no intermediate logged values would be required to show the historical trend of the measurement. This technique could also be described as testing for a different rate of change (or slope) of the measurement, and only logging when the straight-line trend changes direction. When the current value is found to deviate outside the tolerance, then the last saved value (current sample – 1), is saved as the next permanent log value, and the current value is shown on the bottom line with a new IDNo.
The right hand column of the Database Grid component either shows an Error field (Data Acquisition Local) or Status field (Remote Data Acquisition). The former refers to P-NET transmission integrity, where zero indicates no errors. The latter refers to aspects of the operation of the Data Collect Channel, including how a particular logged value has been derived. The meaning of each of these code types can be found in the help file associated with the Database Grid component.
Related TopicsDisplaying Plotted Curves on a Chart Using Curves to Show Historical Trends
|
|
|